
Introduction
Every now and then, we get a notification about poor air quality in our area. But what does that really mean?
In this article, we will explore the factors that contribute to air quality, the common pollutants found in the air, and how they can impact our health and the environment.
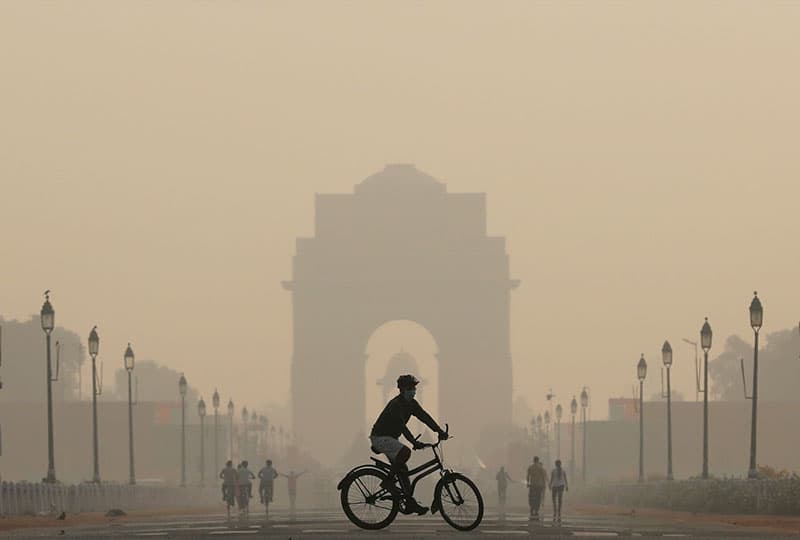

What is Air Quality?
Air quality refers to the condition of the air in our environment, particularly the presence of pollutants. Good air quality means that the air is clean and safe to breathe, while poor air quality indicates that there are pollutants present that can be harmful to both humans and the environment.
Air quality is typically measured using various indicators, including the concentration of specific pollutants and the overall air quality index (AQI).
What are Common Air Pollutants?
There are several common air pollutants that can affect air quality. Some of the most significant include:
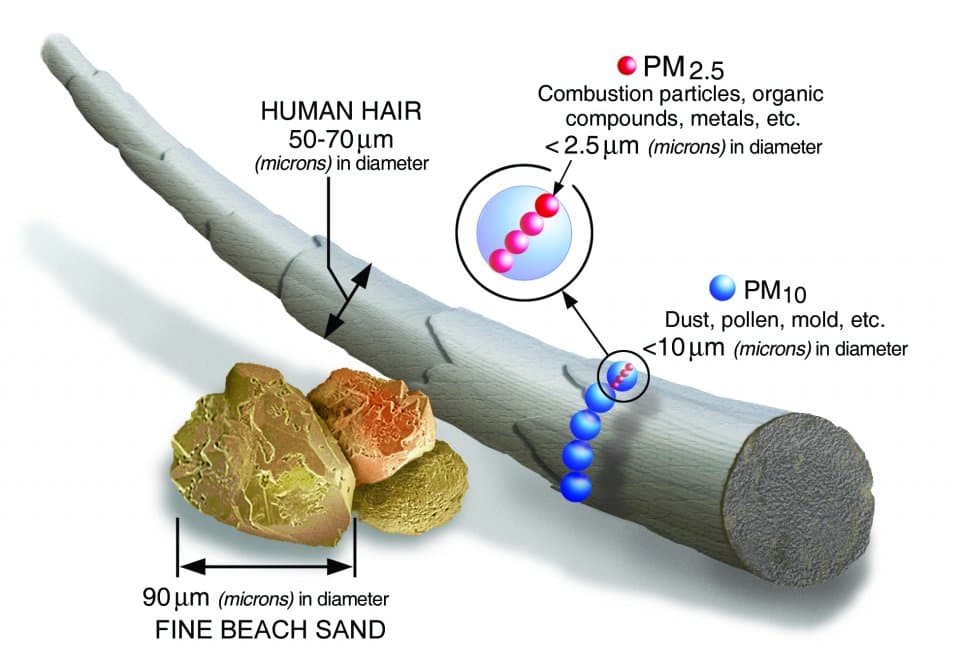
- Particulate Matter (PM2.5 and PM10): Extremely small solid or liquid particles suspended in the air, including dust, dirt, soot, and smoke. PM2.5 refers to particles that are 2.5 micrometers or smaller in diameter, while PM10 refers to particles that are 10 micrometers or smaller.
- Nitrogen Dioxide (NO2): A highly reactive gas produced by burning fossil fuels, including emissions from vehicles and power plants.
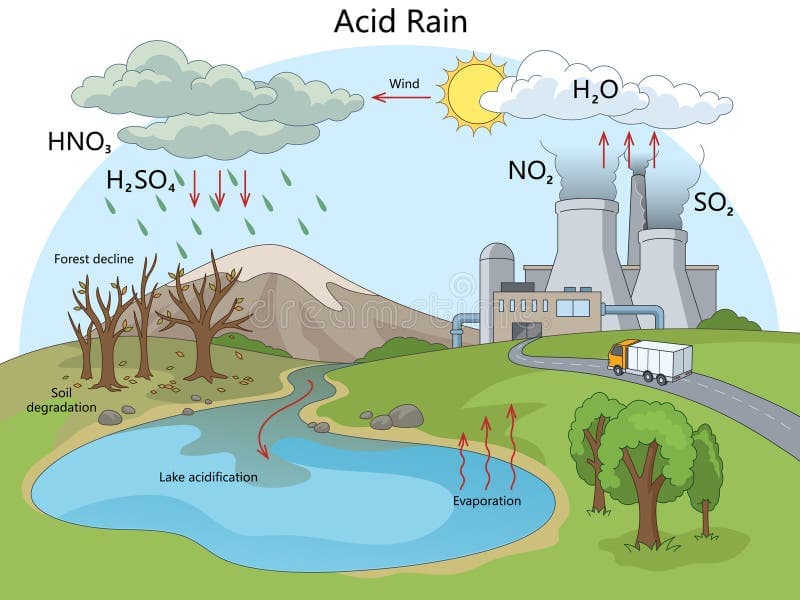
- Sulfur Dioxide (SO2): A reactive gas that can be naturally occurring but is primarily produced by burning fossil fuels, such as coal and oil. It is a major contributor of acid rain.
- Carbon Monoxide (CO): A colorless, odorless gas resulting from incomplete oxidation of carbon during combustion.
- Ozone (O3): A gas that can be beneficial in the upper atmosphere but harmful at ground level, where it is a major component of smog.
How Are Air Pollutants Formed?
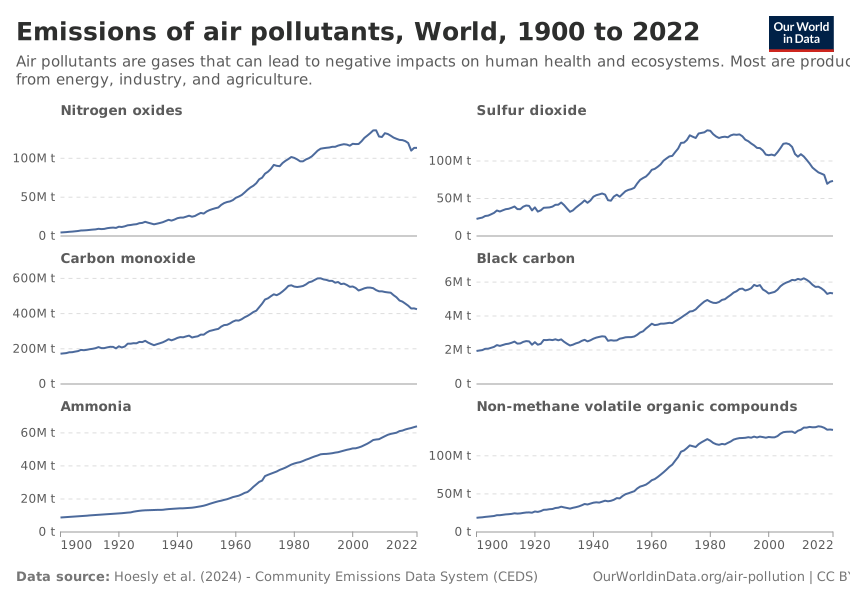
Air pollutants can be formed through both natural and human activities. Natural sources of air pollution include wildfires, volcanic eruptions, and dust storms. Human activities, such as industrial processes, transportation, and the burning of fossil fuels, are major contributors to air pollution.
What Determines Air Quality?
Air quality is influenced by both the amount of pollution released and environmental conditions that affect how pollutants spread. Important factors include:
- Weather conditions: Wind can disperse pollutants, while stagnant air can trap them near the ground.
- Temperature inversions: A layer of warm air above cooler air can prevent pollutants from rising and cause them to accumulate near the surface.
- Geography: Mountains, valleys, and urban areas can affect how pollutants move and accumulate.
- Seasonal changes: Pollution levels may increase during certain seasons due to factors such as increased heating, wildfires, or agricultural activity.
How Air Pollution Affects Human Health
Air pollution can have a wide range of health effects, depending on the type and concentration of pollutants present in the air. Short-term exposure to high levels of air pollution can cause symptoms such as coughing, throat irritation, and shortness of breath. Long-term exposure can lead to more serious health problems, including respiratory diseases, cardiovascular diseases, and even cancer.
Sensitive groups, such as children, the elderly, and individuals with pre-existing health conditions, are particularly vulnerable to the effects of air pollution.
Air pollution can also indirectly contribute to accidents and injuries by reducing visibility and creating hazardous driving conditions, especially during events such as wildfires or heavy smog.
According to the World Health Organization (WHO), air pollution is responsible for an estimated 6.7 million premature deaths globally each year.
How Air Pollution Affects the Environment
Air pollution can also have significant impacts on the environment. Pollution can damage ecosystems, harm wildlife, and contribute to climate change. For example, nitrogen oxides and sulfur dioxide can lead to acid rain, which can damage forests, lakes, and soil. Ozone at ground level can harm crops and other vegetation.
A study conducted by E.J. Catcott in 1961 examined the effects of air pollution on animals during documented air pollution disasters. Additionally, laboratory tests were conducted to demonstrate the effects of particular pollutants on animals. The study indicated that pollutants such as sulfur dioxide, nitrogen oxides, and ozone can cause respiratory problems, tumor formation, and various other health issues in animals.
What Is Being Done to Lower Air Pollution
In 1970, Congress passed the Clean Air Act, which established a framework for regulating air pollution and expanded the responsibilities of the Environmental Protection Agency (EPA). The law regulates and limits emissions from sources such as motor vehicles and power plants.
How the Air Quality Index (AQI) Works
The Air Quality Index (AQI) is a standardized system used to communicate how polluted the air is and what associated health effects might be a concern.
The AQI scale typically ranges from 0 to 500, although values above 500 may occur during extreme pollution events, with higher values indicating worse air quality. The index is divided into categories that correspond to different levels of health concern:
- 0–50 (Good): Air quality is considered satisfactory, and air pollution poses little or no risk.
- 51–100 (Moderate): Air quality is acceptable; however, there may be a moderate health concern for a very small number of people who are unusually sensitive to air pollution.
- 101–150 (Unhealthy for Sensitive Groups): Members of sensitive groups may experience health effects. The general public is not likely to be affected.
- 151–200 (Unhealthy): Everyone may begin to experience health effects; members of sensitive groups may experience more serious health effects.
- 201–300 (Very Unhealthy): Health alert: everyone may experience more serious health effects.
- 301–500 (Hazardous): Health warnings of emergency conditions. The entire population is likely to be affected.
How AQI is Calculated
The AQI is calculated based on the concentrations of various pollutants in the air. Each pollutant has its own concentration-based index, which is then used to determine the overall AQI value.
The formula for calculating the AQI for a specific pollutant is as follows:
where:
- = the index for pollutant p
- = the pollutant concentration after rounding/truncation according to AQI rules
- = the concentration breakpoint that is greater than or equal to
- = the concentration breakpoint that is less than or equal to
- = the AQI value corresponding to
- = the AQI value corresponding to
The breakpoints for each pollutant can be found in the following table provided by the United States Environmental Protection Agency (EPA):
| AQI Category | AQI | (ppm) 8-hour | (ppm) 1-hour | (µg/m³) 24-hour | (µg/m³) 24-hour | (ppm) 8-hour | (ppb) 1-hour | (ppb) 1-hour |
|---|---|---|---|---|---|---|---|---|
| Good | 0–50 | 0.000–0.054 | — | 0.0–9.0 | 0–54 | 0.0–4.4 | 0–35 | 0–53 |
| Moderate | 51–100 | 0.055–0.070 | — | 9.1–35.4 | 55–154 | 4.5–9.4 | 36–75 | 54–100 |
| Unhealthy for Sensitive Groups | 101–150 | 0.071–0.085 | 0.125–0.164 | 35.5–55.4 | 155–254 | 9.5–12.4 | 76–185 | 101–360 |
| Unhealthy | 151–200 | 0.086–0.105 | 0.165–0.204 | 55.5–125.4 | 255–354 | 12.5–15.4 | 186–304 | 361–649 |
| Very Unhealthy | 201–300 | 0.106–0.200 | 0.205–0.404 | 125.5–225.4 | 355–424 | 15.5–30.4 | 305–604 | 650–1249 |
| Hazardous | 301+ | 0.201+ | 0.405+ | 225.5+ | 425+ | 30.5+ | 605+ | 1250+ |
Note: The breakpoint values may differ depending on the country or region.
The AQI reported to the public is the highest index value calculated among all measured pollutants.
For example, if the concentration of PM2.5 is measured at 40 µg/m³, we can use the breakpoints to calculate the AQI for PM2.5:
Assuming this is the highest pollutant AQI, this would be the AQI reported for the day.
Further Reading & Sources
- Clean Air Initiative: What Is Sulfur Dioxide?
- Catcott, E. J. "Effects of Air Pollution on Animals." Monograph Series, World Health Organization, vol. 46, 1961, pp. 221–231.
- BBC News: Air Quality Improves After Coronavirus Lockdown
- Encyclopaedia Britannica: The Six Criteria Air Pollutants
- Encyclopaedia Britannica: Particulate Matter
- EPA: What Is Acid Rain?
- EPA: Ground-Level Ozone Basics
- EPA: What Is Carbon Monoxide?
- EPA: Basic Information About NO₂
- EPA: Particulate Matter (PM) Basics
- EPA: Sulfur Dioxide Basics
- AQI Technical Assistance Document
- World Health Organization (WHO): Air Pollution
- World Health Organization (WHO): Ambient (Outdoor) Air Quality and Health